Stenos Signals 11 - Inflationistas vs Recessionistas
Is this a return to a 70s-like fight between inflation and recession? The energy supply scarcity is likely to bring about yuge business cycle volatility in coming years until the situation is settled.
Before we start, first things first - I'm all about saving time. Trying to keep up with the endless economic data that comes out each day can be... overwhelming. And frankly, culling the signal from the noise is a full-time job. One of my favorite shortcuts is the Daily Edge by Invictus Research.
The Daily Edge is a 6-10 minute video that covers all of the important economic data and market moves from the day prior. It's short, consumable, and 100% focused on connecting the dots between the economy and the markets (i.e. making you $$). It's like having a professional hedge fund analyst working for your portfolio... Except that it only costs ~$2/day. Use the discount code STENO at checkout for a 30-day free trial (link here).
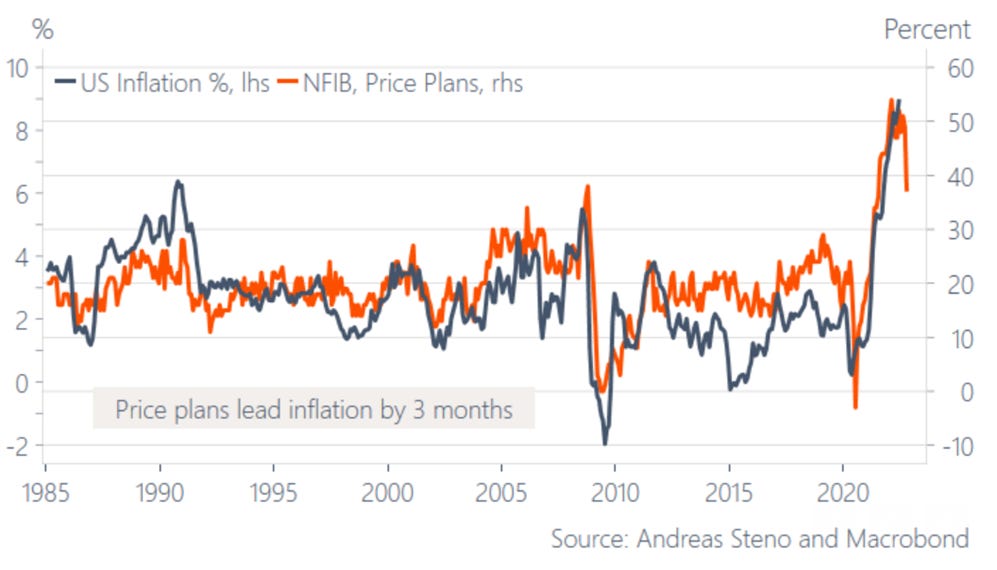
The CPI prints are fresh out of the printer and we are getting hints that inflation might have peaked. The big question now is whether we will see further downside pressure to inflation. This week, we got an indication with the NFIB releasing its price plans from SMEs which pointed downwards. Even if this has allowed the chatter on a potential soft landing to resurface, we still see this as a battle between inflationistas and recessionistas, which will allow for pockets of “Goldilocks-phoria” such as in July and early August.
Chart 1. Unless SMEs are lying, inflation has peaked for now.. Will it change the market psychology?
The eurodollar market has been early in equating a slowing growth/peak inflation with a Fed pivot. Currently the market expects Jay Powell to take the foot off the pedal in 6 months from now, which is why the stock market has been partying like there is no tomorrow for the last month. There is a difference between peak inflation and a Fed pivot, though. Remember last week when Neel Kashkari said “We are a long way away from achieving an economy that is back at 2% inflation, and that’s where we need to get to.” The Fed seems keen on killing inflation and nothing is going to stop it in its way. So we are not overly convinced on loading up on ARKK just yet. In other words, it may be too early to fight the Fed, even if there is arguably a short-term window of opportunity for equities in general.
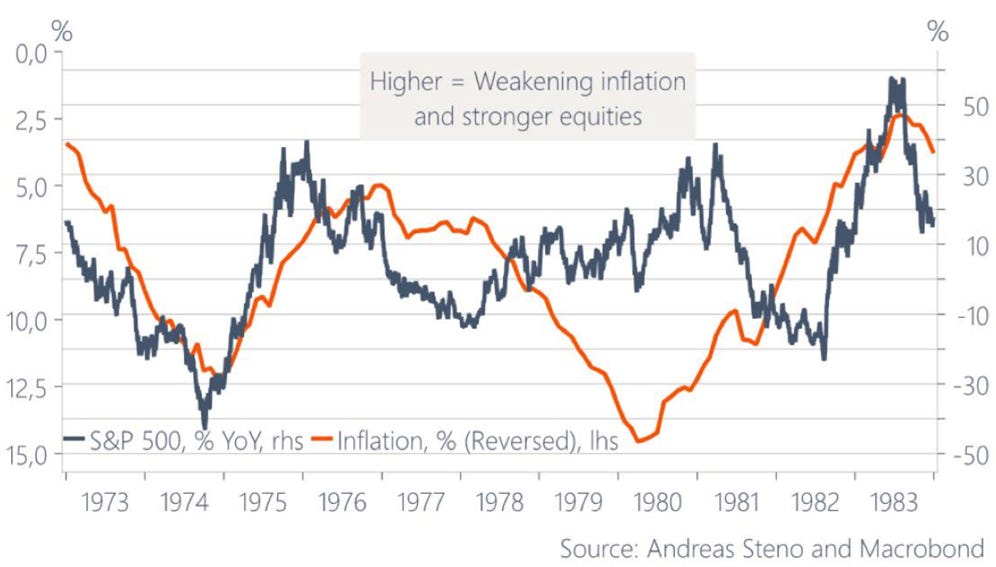
In the 1970s, the peak in inflation proved THE timing to load up on risk assets, but the missing link is a bottoming growth cycle. We are far from convinced that the soft landing is back on the table, just because inflation momentum has waned. The swiftly weakening growth cycle may rather be the EXACT reason why inflation has started to fade.
Chart 2. Load up on equities when inflation peaks? The 1970s experience says yes, but it is probably too early..
The reason is that the market has already forgotten about the almost historical interest rate shock from the spring. If we look at lagged effects from the increase in bond yields, the PMI should drop to levels around 35-40 into the early parts of 2023. This is not what a soft landing looks like. Commodity markets have been telling the same story over the past couple of months. A falling demand is the reason for falling inflation momentum.
Chart 3. Ready for PMI under 40?
So where to position exactly? As mentioned above equities have in general been the place to be in the last month and they also rallied on the back of yesterday’s CPI print. Tech and discretionaries especially. However, I feel equities are a bit emotional in this case and at some point the most speculative parts of the market will have to realize that liquidity is getting drier than a vodka martini.
On the other hand, I cannot ignore how downward pressure on inflation affects equities positively. Just look at how they behaved during the 70s when inflation rolled over! As they say, history does not repeat, but it rhymes. Therefore I have my sights on a long S&P, short Dax position. I am long 1 unit of Xtrackers ShortDAX Daily Swap UCITS ETF 1C and long 1 unit of any S&P500 ETF. Furthermore, the correlation between US and Euro area inflation increases, if you lead US inflation by 3 months. That should make European inflation peak around Q4, which is great for the long SPX, short DAX trade.
Chart 4. US inflation leading European by 3 months
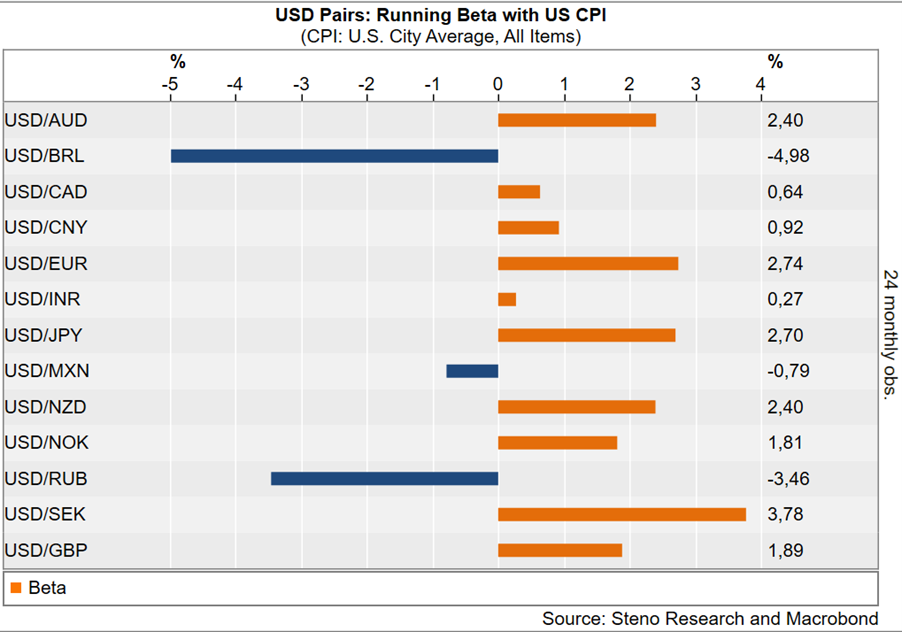
Moving on to FX where I am planning on exiting my DXY position given my view on peak inflation. I am also pretty intent on keeping my TLT position. It is a party in the front and business in the back of the yield curve environment still and the long end of the curve is all about the growth story. Even if the Fed decides to hike even more aggressively that just leads to an even further curve inversion due to the negative growth story.
The higher you fly, the deeper you fall.. That also goes for commodities which have been the winners of Q1 and Q2. As highlighted in my latest newsletter, slowing PMI numbers will have an impact on commodities and therefore I am long SALL WisdomTree Broad Commodities 1x Daily Short.
Chart 5. USD sensitivity to falling CPI
Winter is coming in Europe
The energy crisis in Europe will be the story to follow this fall and winter. Murphy’s law of "Anything that can go wrong will go wrong, and at the worst possible time." seems particularly accurate in instance.
Natural gas and electricity prices have exploded higher and are up 12-15x since 2015 in most European countries. Whether it is Russia cutting off Nord Stream supplies, London nearly blacking out, internal conflicts about gas rationing in the EU, extremely low water levels in the Rhine or France nuclear electricity production running 30-40% below its 10yr average, the list of problems seems endlessly long. One thing’scertain, this will have an impact on European growth this winter.
The question is when to fade this extremely negative sentiment on Europe? Not yet, but if inflation peaks in Q4 as I expect, that may be the timing (yes, I said that).
Chart 6. Energy not just a German problem
We could be starring into a 70s style periode shifting between inflation and recession-driven disinflation, where central banks need to kill supply driven inflation with a recession. We are probably running with the story of ‘inflation is over’ and then the economy bottoms out 3-6 months from now. After that the same supply driven inflation issue will rear its ugly head and thus continue to trigger business cycle volatility until we solve the underlying food and energy supply problems.
For now, long SPX vs. DAX, short commodities (or Oil outright) and long US Treasuries +10-20yrs will be my plays.
Chart 7. Get ready for a 70s style inflation roller coaster?
Remember that I release a free macro podcast with my buddy Alfonso Peccatiello every Sunday. “The Macro Trading Floor” is waiting for you.
If you liked this free content, you can donate a few USDs here.
Thanks for the support out there!


Great, thanks, very generous & I am looking very much forward to reading your article. Reading up on things, I‘m picking snippets but yet struggle to merge into a readable puzzle. Thus, get a rough framework nailed, would be hugly appreciated!
Thanks, your notes indeed save time, put main emphasis & give direction where the market‘s center of gravity currently is! On that note, one thing I really long to see from a pro like you too. How you destilled information down & condesed signals into a daily cockpit (bbg dashboard, leading/lagging indicator hierachy, asset class interconnectivity, you name it!). My focus is micro, company lvl, single bonds. Hence, i‘m very keen to see/learn through which concrete lenses you watch to steer your thinking. Appreciate any color, thanks Andreas!