Stenos Signals #10 - How to position for a landslide in PMIs?
What happens in markets when the ISM Manufacturing index drops below 50 over the next quarter? We have looked across all assets with interesting findings.
Before we get started, I want to get something off my chest. Reading through government economic reports and modeling out all of the data is exhausting... and sometimes boring. One of my favorite ways to save time (and cut through the noise) is watching the Daily Edge by Invictus Research.
The Daily Edge is a 6-10 minute video that is delivered to your inbox covering all of the important economic data and market moves from the day prior. It's short; it's quality; and it's created by Mike Singleton, an investor with years of buy side experience. Use the discount code STENO at checkout for a 30-day free trial (link here). Buyside quality coverage of the most important economic data - all for the price of a cup of coffee. In this market, that might be the best deal you can find.
Since my last newsletter recession calls have become en vogue with a lot of indicators pointing to (much) lower growth. After mistiming a couple of trades in the beginning of the year I have gotten a bit of redemption during the last couple of months. Most notably from my long USD position via the long UUP ETF and my long consumer staples/short consumer discretionary position. Don’t pitch the inverse Steno ETF to your broker just yet! Before we dive into various asset classes let’s have a look at yesterday’s key FOMC takeaways!
Jay Powell: We will hike until we break stuff
Don’t get tempted to jump to early conclusions on the heels of the massive risk-on rally after the Federal Reserve meeting this week. The Fed will continue to hike interest rates until something breaks. By ending forward guidance and adopting a meeting-to-meeting approach, the Fed will rely even more on lagging indicators such as the unemployment rate and the monthly CPI report. Once unemployment starts increasing alongside weakening momentum in the inflation reports, it will likely be at least 3-6 months too late to pivot.
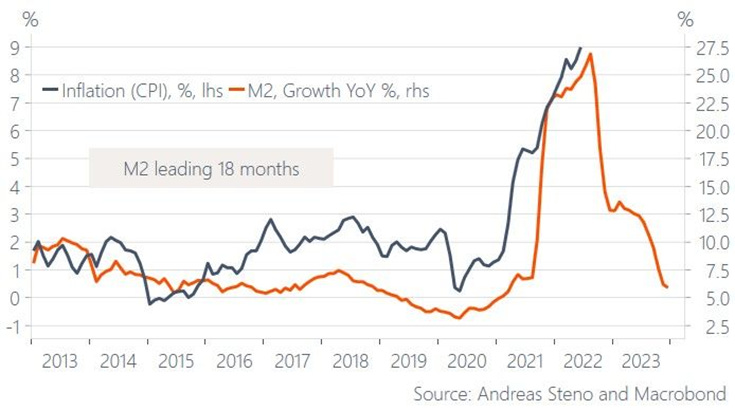
Most leading indicators for inflation point (seriously) down, while early unemployment indicators are ticking up, but the Fed will not admit to it until risk assets have taken another beating.
Chart 1. If M2 mattered on the way up, it also matters on the way down, right?
PMIs about to fall off a cliff?
The Fed has been loud and clear in its intent to bring down inflation. The determination to bring down inflation has inverted various points between short-end tenors and longer-term tenors on the yield curve.
Most recently even Jay Powell’s favorite 18m forward 3-months yield minus 3-month yields inverted (in OIS terms). It will be exciting to watch which new tenors on the curve the Fed Chair will use to explain to us that the economy won’t contract. We are getting some serious ‘Emperor’s New Clothes' vibes when listening to J-Pow these days.
In this piece, we will look at how asset classes perform when PMIs drop substantially below 50, which I find likely over the next 3-6 months. Just see the yield-curve based model below.
Chart 2. A yield curve-based model suggests that ISM will print at <40 levels in Q1-2023
Fixed Income and FX: Do you hear the bond market screaming!?
As mentioned, I got burned in an attempt to long bonds prior to the Russian invasion of Ukraine but given the current outlook I have decided to venture back into the trade (Long TLT ETF). The reasoning is pretty clear… The bond market is screaming that the Fed will have to pivot.
Around recent hiking announcements from the ECB and the Fed, the market has traded long bond yields lower despite further hikes, which is the strongest signal the Fixed Income markets can send. Enough is enough. Unless the Fed and the ECB backs down, we should expect long bond yields to follow PMIs lower.
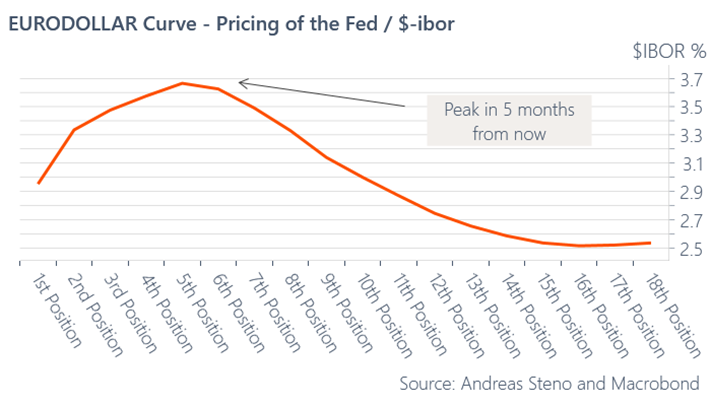
Chart 3. The Eurodollar curve is seriously inverted by now
In a span of one month the Eurodollar curve has moved significantly and the market is now positioned for rate cuts in 6-7 months from now. Even with this pivot priced by the Fed, I don’t want to exit my long USD position.
During the Corona madness in March 2020 the dollar spiked in a dash for cash and if the market gets scared by the Fed’s liquidity withdrawals, we could see the same happening again. Another reason for my continued belief in the Dollar is the huge change of scenery in the Eurozone with a trade balance that suffers big time from rising energy prices.
Chart 4. The German Trade Balance is falling off a cliff due to energy prices
Equities: Which sectors are most vulnerable to a PMI landslide?
Is it time to buy tech again? Not really. The massive relief rally in Nasdaq after the FOMC-decision is a false flag in my opinion, but there is an interesting change of dynamics upcoming in the equity market, if the growth narrative will be in the driver's seat over the coming 3-6 months, which I find likely. During the spring and early summer, Tech suffered as it is probably THE most vulnerable sub-sector to the compression of multiples that follows an inflation and rates shock.
Chart 5. Equity beta to CPI (1%-point inflation = x% move in the equity sector)
The Tech-sector is unlikely to be THE problem child of a growth-based sell-off in risk assets over the next 3-6 months. The reason is that multiples are partly sugarcoated by a potential drop in the terminal rate or the long bond yield, which is a relative windshield for Tech stocks compared to other sectors.
The financial sector is the most vulnerable equity sector to a landslide in PMIs, while also consumer discretionary, materials and industrials are worth mentioning. I remain long consumer staples and short consumer discretionary consequently (long stuff you need, short stuff you don't need) as this cycle is very different from earlier growth slowdowns due to the inflation driven nature of the demand destruction.
Chart 6. Equity beta to PMIs (1 index-point in the PMI = x% move in the equity sector)
Commodities: Energy will likely remain expensive, but industrials likely to sell off
Though China has not received the memo, we, the developed world, have slowly but surely put our Covid-jitters behind us. The Chinese zero covid policy is still very visible in macro data from China and this is on a standalone basis a reason to be skeptical on industrial metals such as copper.
Chart 7. Mind the gap between Chinese activity and commodity prices
Meanwhile, ze Germans are under increasing pressure ahead of the Winter season. Nord-stream flows continue to drop, while electricity prices for December 2022 are going absolutely ballistic. The ongoing nuclear capacity issues within Électricité de France adds to the European energy woes, and I am not sure that we have seen the worst yet. Even if politicians are not telling you (yet), you should expect widespread rationing in Europe this winter unless a deal with the Russian government is struck. Hmm…
And remember that Italy uses natural gas in the electricity production to a much larger extent than the Germans... Time to put the TPI (Temporary Protection of Italy) into use, Madame Lagarde? For now it makes sense to be short Italian bonds (versus German) until the ECB tells you otherwise.
Chart 8. German electricity prices for the winter of 2022 have gone ballistic
Interestingly, the severity of the energy crisis now leads to a reverse correlation between energy prices and industrial metals. As higher natural gas prices lead to higher electricity prices, metals used in production, buildings and manufacturing get kneecapped by the cost of energy - full circle or rather a circular error as a spreadsheet would put it.
It may be worthwhile exploring this spread trade between being long Energy and short Industrial Metals, but I decide to enter a short position in broad commodities via the SALL ETF instead. For every 1-point drop in the ISM index, you should expect at least a 4% drop in industrial metals and maybe even more if we take the latest 90-day covariation at face value.
Chart 9. Commodity beta to PMIs (1 index-point in the PMI = x% move in metals)
To sum up. Growth is slowing fast. PMIs are likely headed below 50 soon. I stay long USD (UUP ETF), buy long bonds (TLT ETF), stay long consumer staples vs. short consumer discretionary and buy the inverse broad commodity position (SALL ETF) expecting further downside in industrial metals.
If you are interested in a partner/sponsorship feel free to contact me at andreassteno@stenoresearch.dk
Ultimately, let me announce that I have signed with Real Vision (as some of you may have noted already). To follow my work at RV, please find the subscription page here.
If you liked what you read, here is a chance to donate to the authors of the piece → https://www.paypal.com/donate/?hosted_button_id=CBPKHYZ3ZEUN2
***Remember that I release a free podcast on the macro trading environment with my buddy Alfonso Peccatiello each Sunday. “The Macro Trading Floor” awaits you :)***
DISCLAIMER
The content provided in Stenos Signals newsletter is for general information purposes only. No information, materials, services, and other content provided in this post constitute solicitation, recommendation, endorsement or any financial, investment, or other advice. Seek independent professional consultation in the form of legal, financial, and fiscal advice before making any investment decision. Always perform your own due diligence.


Great newsletter. Some wonderful charts, ty!
Great stuff!